
Cardiology Case #19
Primary Author: Dr Alastair Robertson; Co-Authors: Dr Hywel James and David Law
Background:
An 83 year old man presents to ED with several days of worsening breathlessness, lethargy, and cough. He has a background of CKD 3 and Hypertension and has missed some doses of his diuretics over the last few days due to feeling unwell.
His observations are:
RR 26, Sats 93% on 3L/min oxygen via nasal prongs, HR 110, BP 96/65, temp 35.0
Chest XR and ECG are shown below, what do you think?
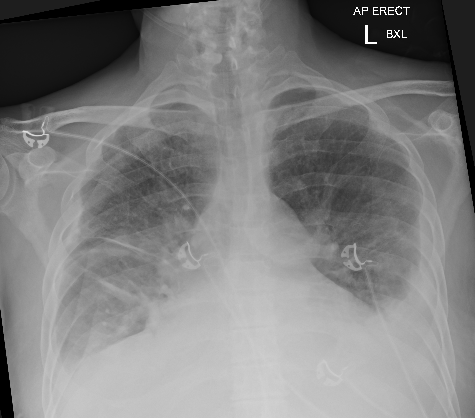
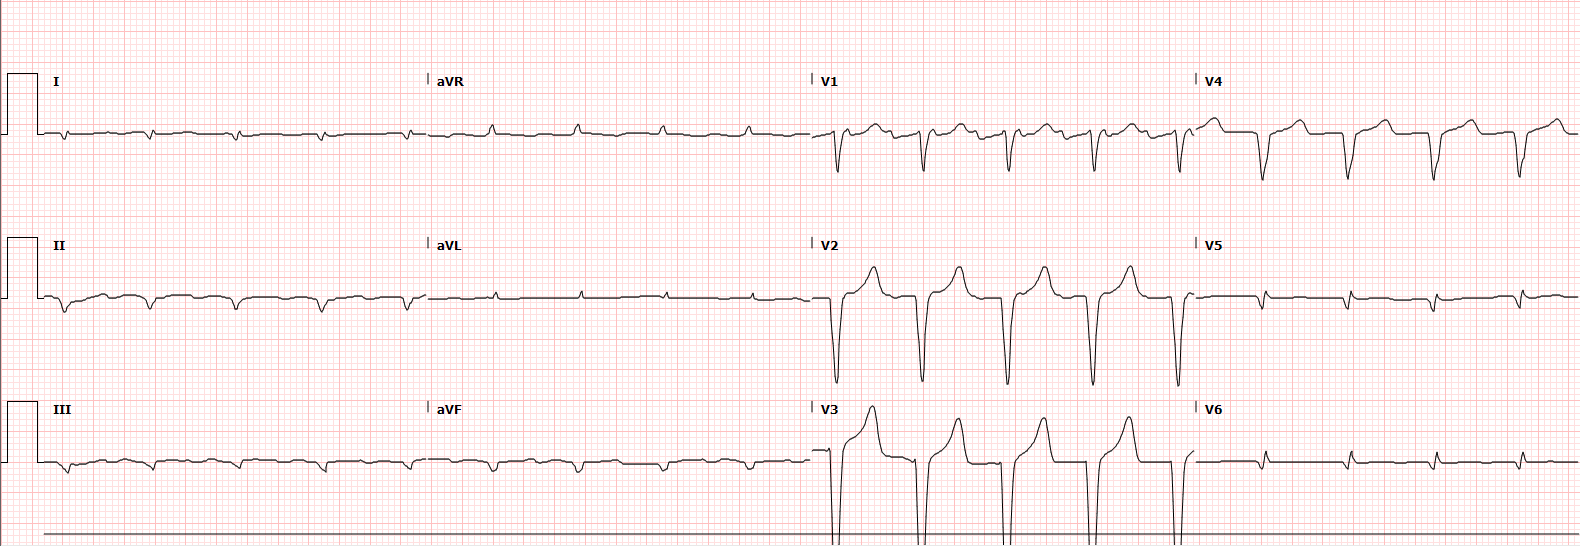
-
CXR shows bilateral pleural effusions and marked bilateral pulmonary oedema. There is likely cardiomegaly (noting AP film)
This is in keeping with severe pulmonary congestion.
ECG shows a regular rhythm at a rate of 108/min, most likely atrial flutter with 2:1 block given number of flutter waves visible in V1. A rate closer to ~ 100bpm in flutter would typically be 3:1 block.
There is an incomplete LBBB (QRS duration just under 120ms) with a LAFB.
Delayed R-wave progression, and small complexes in the inferior and lateral leads.
There are no clear ischaemic ST changes.
QT is borderline prolonged, with a Bazett corrected QT of 483ms.
Cardiac POCUS:
There was clear clinical suspicion that this patient was in cardiac failure. Here POCUS can be useful to assess the degree of failure, and to help guide management strategies - in particular diuresis and inotropic therapy.
The Parasternal Long-Axis (PLAX) is one of the most useful views as it gives a lot of information about the heart.
Always increase the depth before obtaining the initial PLAX view to ensure that you do not miss any large pleural or pericardial effusions. Once you have assessed for these decrease the depth to focus on the heart (in particular the LV) itself.
Below are two PLAX views.
The top view is the initial view obtained.
The bottom view is focussed on the LV once surrounding pleural and pericardial spaces have been assessed.
How would you interpret these images?
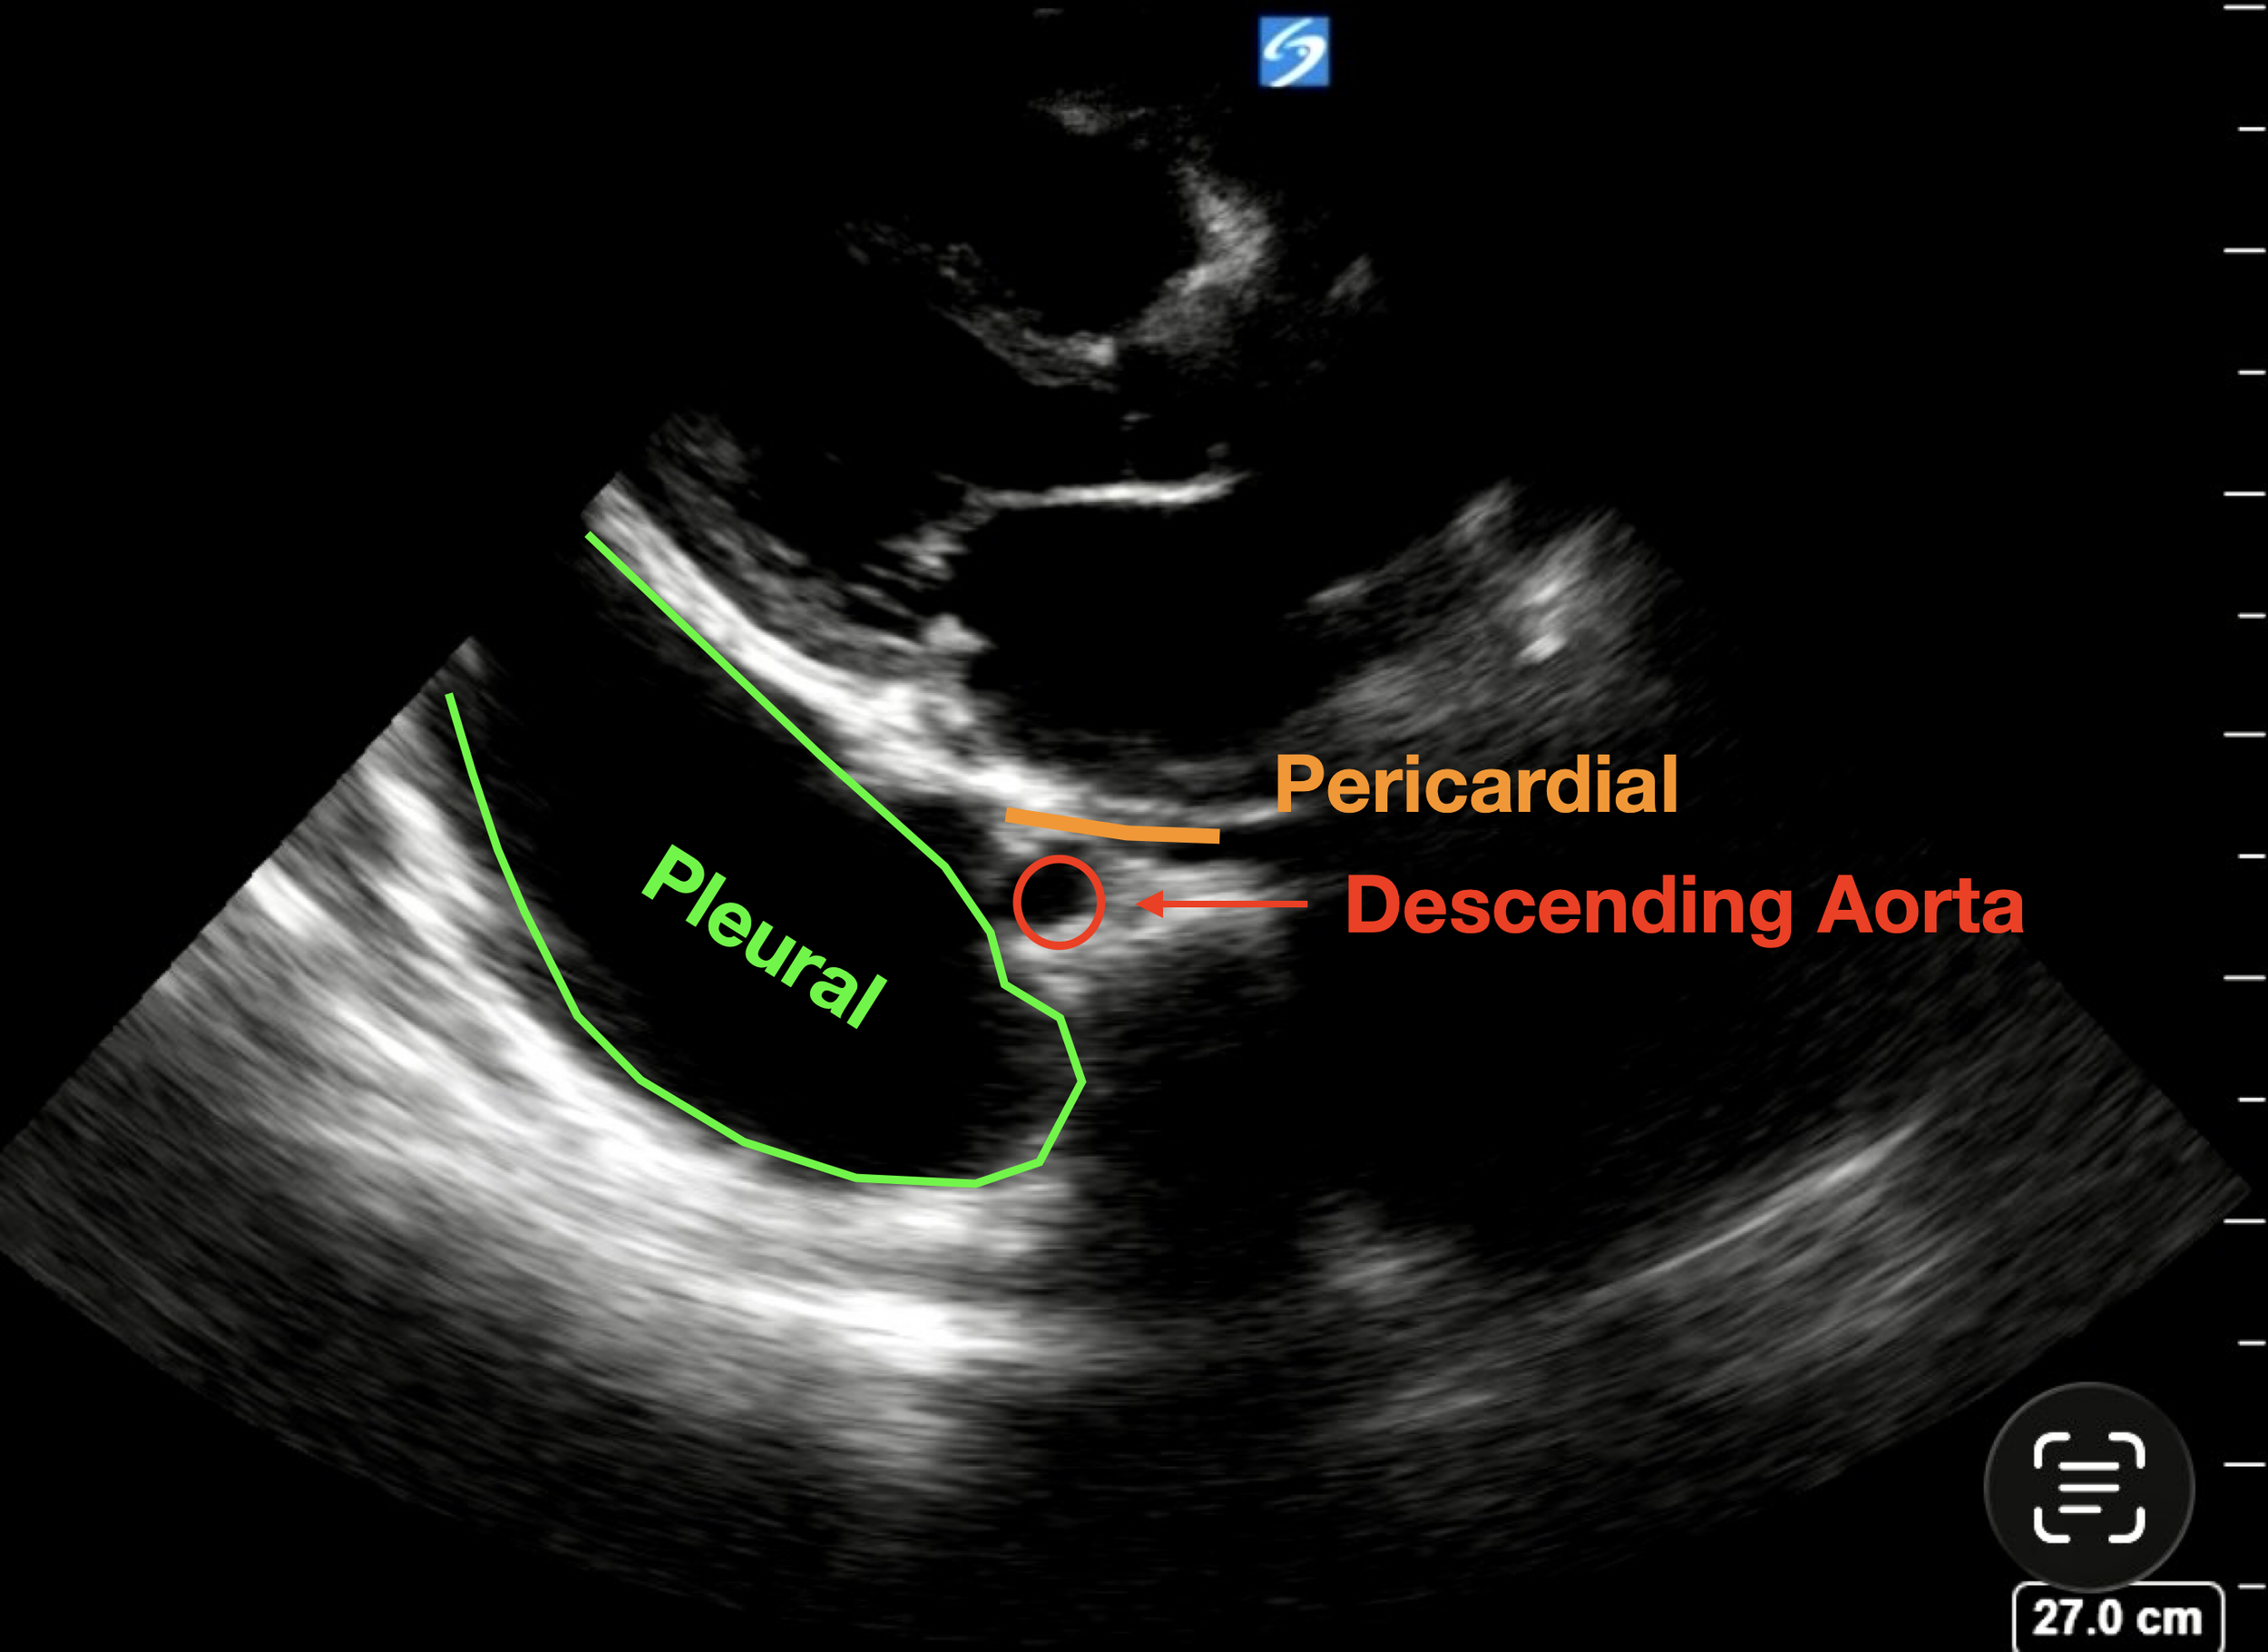
Basic POCUS: the initial PLAX
In the top image the heart can be seen sitting in the top third of the screen. In the bottom left of the screen there is a large left-sided pleural effusion (extending towards the LV apex). There is also probably a large right pleural effusion sitting on the bottom right of the image. These effusions could be easily missed if the depth was not set deep enough on the initial view.
There is possibly a trace pericardial effusion sitting above the pericardium but it is trivial.
An important structure to visualise is the descending thoracic aorta - which is the small circular structure just below the left atrium. If you remember from previous cases (see bottom picture):
Pleural Effusions track behind (deep to) the descending aorta (green)
Pericardial Effusions track in front of (superficial to) the aorta (potential space in orange line)
The bottom clip is exactly the same view, but with the depth reduced to focus on the heart itself - note how you can still see the bright line behind the pleural effusion, but if the depth was reduced any further it would easy to miss the pleural effusion.
In this view we can see:
No significant pericardial effusion (the effusion tracks behind the aorta so is pleural)
RV : Aortic Root : LA ratio is not normal - both the Right Ventricle (top of image) and the Left atrium (bottom) appear larger than the aortic root. This suggests probably some RV dilation, and significant left atrial dilation.
Aortic valve can be seen opening (leaflets look normal, no significant aortic stenosis), and the mitral valve leaflets are slightly thickened but appear anatomically normal.
Function of the Left Ventricle is SEVERELY IMPAIRED with both anterior septum (top) and posterior wall (bottom) contracting very poorly.
So this patient has severe LV impairment with large pleural effusions, a dilated left atrium, and likely dilated right ventricle. This fits with severe cardiac failure (HFrEF) and fluid overload which needs to be addressed.
To see why this is Severe LV impairment read on…
Intermediate POCUS:
Right, now let’s look at the apical views to confirm the global LV impairment, as well as look for mitral regurgitation and to assess the right ventricle.
Below are apical images (the top and middle pictures are an Apical 4-chamber), while the bottom image in an ‘RV Focussed View’ - look at how the RV appears slightly different.
POCUS interpretation:
Apical 4-Chamber:
The top clip (A4C) confirms global severe LV impairment which also includes the LV apex.
Mitral Regurgitation:
We can see in the middle clip there is centrally directed mitral regurgitation. This is ‘functional MR’ which is caused by the dilation of the LV due to failure and volume overload stretching the mitral valve annulus and is commonly seen in severe cardiomyopathy. Functional MR is typically centrally directed. Significant MR due to valvular issues (e.g. flail leaflet) looks different as it is often directed around the wall of the atrium (the eccentric jet) by the shape of the leaflets.
In a normal heart, this would be graded as mild-to-moderate mitral regurgitation. However this is a struggling heart with a very low stroke volume. In the setting of a ‘low-flow’ state such as this the severity of regurgitation is often under-estimated. This amount of regurgitation represents moderate-to-severe MR when the cardiac output is taken into account.
RV Focussed View:
The bottom clip is a ‘Right-Ventricle Focussed’ Apical 4-chamber view. This is obtained by sliding the probe slightly laterally from the cardiac apex and hooking back to visualise the right ventricle, focusing on the tricuspid valve. This view is important to accurately assess RV size as a ‘true’ apical view can still overestimate RV size. If you compare the (bottom) RV focused clip, with the top (A4C) clip, you will notice how different the RV looks.
In this focussed view we see that the RV is still dilated, with at least moderate systolic impairment.
It is important to try and gain a RV focussed view to assess the RV. If your apical window is slightly too medial or too high, is very easy to cut through the RV obliquely. This gives the impression of a dilated RV leading to overestimation of RV size and diagnostic errors.
More Intermediate POCUS: Pulmonary Pressures
Below is the CW doppler trace of the Tricuspid Regurgitation jet, and a clip of the IVC view.
Can you estimate the pulmonary artery systolic pressure (PASP)?
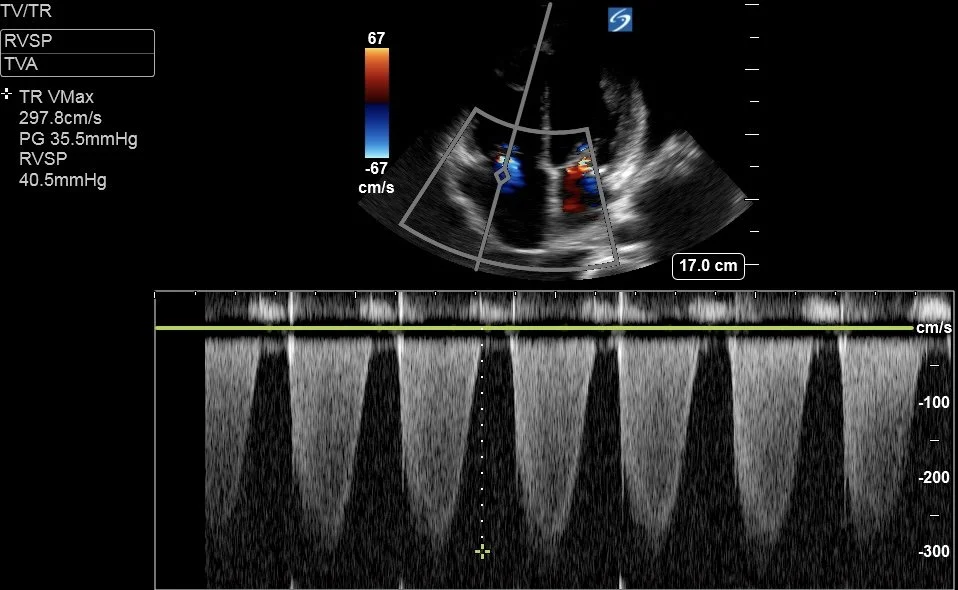
Remember that PASP = RVSP + RAP
RVSP [RV systolic pressure] is measured from the TR Vmax - this is 40.5mmHg as calculated by the machine.
RAP is estimated from IVC size and collapsibility with respiration. As a rule of thumb:
If IVC <2.1cm and:
collapses >50% —> RAP = 5mmHg
collapses <50% —> RAP = 8mmHg
If IVC >2.1cm and:
collapses >50% —> RAP = 8mmHg
collapses <50% or plethoric —> RAP = 12mmHg
Here RAP was estimated at 12mmHg
Thus PASP = 40.5 + 12 = 52.5mmHg
This is classed as moderate PHN, but in the setting of a “low-flow state” this represents Severe Pulmonary Hypertension.
Case Progress:
Bloods showed worsening renal function with an AKI on CKD (Creatinine 450, Urea 30)
There was associated acidosis (pH 7.25, HCO3 20), and hyperkalaemia with a K+ of 6.6.
He had a hepatopathy (ALT 1000, AST 2000), with associated coagulopathy (INR 2.6).
BNP was 2,500 and troponins were static at around 100.
Initial management focused on treating his Hepato-Cardio-Renal syndrome, as well as his pulmonary congestion.
Hyperkalaemia was treated with calcium and insulin/dextrose.
Respiratory support with high-flow nasal prongs
Diuresis was initiated with a furosemide infusion
Vitamin K was given IV to correct coagulopathy
Admitted to ICU where Dobutamine and Noradrenaline infusions were initiated with the aim of targeting a MAP >65mmHg to ensure renal perfusion.
FOCUS on LV Function
Being able to estimate LV function, in particular Ejection Fraction, is an important skill for any critical care physicians. It is key to guiding resuscitation and ongoing management of patients in cardiogenic shock.
There are many ways to estimate Cardiac Ejection Fraction. The absolute reference gold standard is with cardiac MRI. However for practical reasons the realistic gold standard is with echo using Simpson Biplane (described below).
There are multiple other simpler methods to estimate the LV function for intermediate users, and it is worth being aware of these and trying to build them into your POCUS.
Normal Ejection Fraction is 50-65%. (>65% is hyper-dynamic)
45-50% is Mild Impairment
(40-44% is Mild-to-Moderate Impairment)
30-40% is Moderate Impairment
<30% is Severe Impairment
It is important to remember that impairment of LV systolic function can be GLOBAL (the entire ventricle is affected), or SEGMENTAL (only part of the ventricle is affected). Segmental impairment is common with myocardial ischaemia, or stress cardiomyopathy and results in regional wall motion abnormalities. Depending on which regions of the LV are affected the simpler methods below can vastly under- or over-estimate the degree of LV impairment.
Visual Estimation:
Visual estimation is a valid method to estimate EF, and is very accurate with expert operators but requires significant experience to do well. The advantages are that one can use the data gathered from multiple views to build up a picture of LV function which accounts for regional wall motion abnormalities which may be missed by other quantitative methods. The disadvantages are the experience required, and that it is a subjective pursuit which is prone to bias. Visual estimation is used in Basic echo and may well be the preferred method in a rapid assessment of an unstable patient. However as a general rule it is best practice to have some objective data points when you accelerate past basic skills to support your interpretation where possible.
Fractional Shortening (FS):
This method measures the size of the LV base at end-diastole and end-systole, using the difference to calculate the ‘shortening’ of the LV basal diameter. FS is the difference (diastole - systole), divided by the diastolic diameter (x100 to give a %). A normal fractional shortening is around 25-45%. This can be converted to an EF using the ‘Teichholz’ method which assumes the LV is a hollow cone with a uniformly ‘shortening’ diameter (not a perfect model) and the machine will calculate this for you.
To measure the LV base you must obtain a good PLAX view and freeze the clip, before cycling through the frames to find end-diastole (called LVDd aka LVEDD - immediately as the mitral valve closes, when the LV cavity is at its largest), and measuring the LV base through a line through the tips of the mitral valve. Do the same for end-systole (LVDs aka LVESD - the frame immediately before the MV opens, when the LV cavity is at it’s smallest), this time measuring fractionally further towards the apex to allow for the systolic excursion of the mitral valve.
Tips:
measure perpendicularly across the LV [inner edge to inner edge of the myocardium] . The benefit of this method over M-mode is that you can measure more vertically-orientated hearts in which it is often impossible to get the M-mode cursor to track across the LV base faithfully.
watch several cardiac cycles to get an idea of where the LV walls reach during systole to make an accurate measurement of LVDs
This method also gives you an objective LV size, and allows diagnosis of LV dilation (a normal LVDd is generally < 5.5cm but there are differing ranges for men and women, and it is usually indexed to BSA)
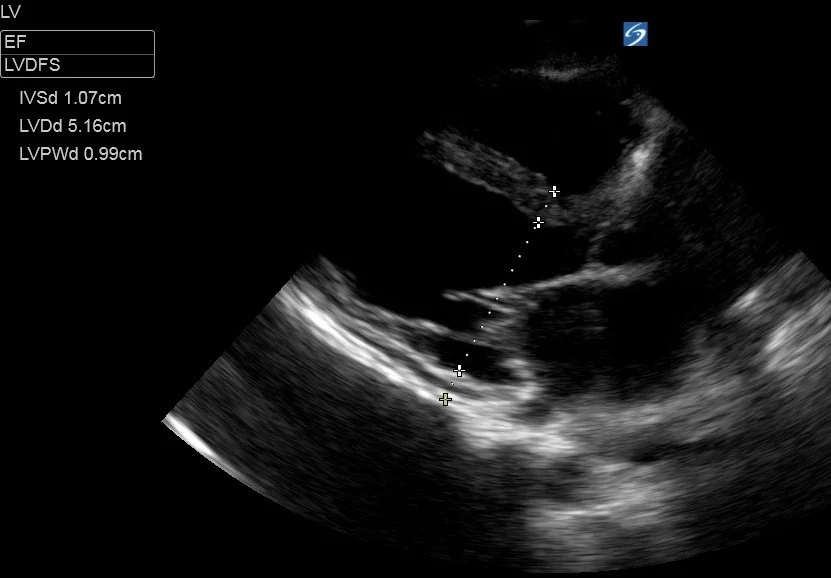
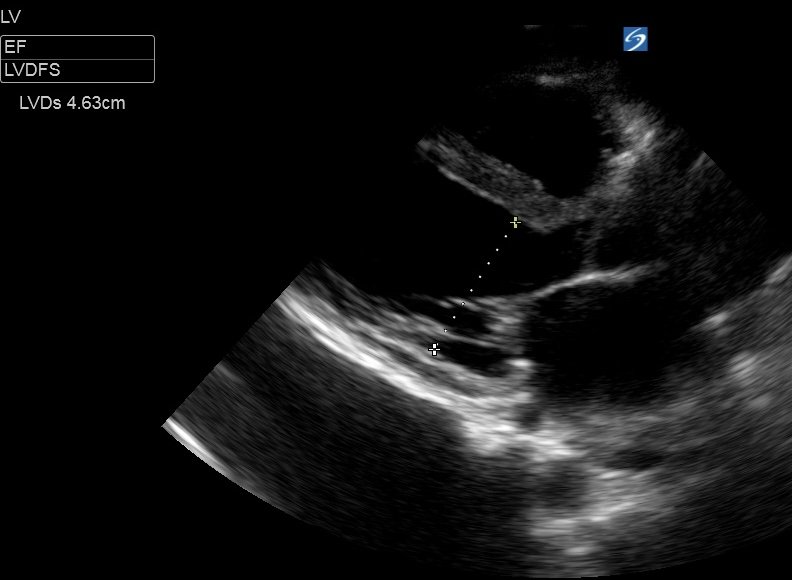
This patient had a LVDd of 5.16cm and LVDs of 4.63cm
Fractional Shortening was ((5.16-4.63)/5.16) x 100 = 10%.
This is severe LV impairment.
Fractional shortening can also be performed using M-mode in either the PLAX or even the PSAX as long as the cursor can be accurately positioned across the LV base. There are also methods which utilise tracing the LV mid-cavity (at level of the pap muscles) in the SAX view to estimate an EF.
Caveats - FS
inaccurate in segmental impairment as it only measures the movement of the LV base in the anterior-posterior plane.
M-mode often not possible with vertically orientated hearts as the cursor cuts obliquely thought the LV overestimating size.
E-Point Septal Separation (EPSS):
This method utilises M-Mode by placing the line through the tips of the mitral valve leaflets and tracking the anterior mitral valve leaflet (AMVL) tip during early diastole. EPSS is defined as the distance between the leaflet tip and the interventricular septum during the ‘E wave’ of early diastolic filling. In a healthy heart, the leaflet tip should almost touch the septum.
It is one of simplest methods to acquire, but it also less reliable than other methods.
Measure the distance between the leaflet tip and the septum. As a general guide:
<6mm - normal LV function
7-12mm - mild to moderate impairment
>13-15mm - severe impairment of function
Caveats - EPSS
inaccurate in segmental impairment or in a dilated LV as it depends purely on the proximal septum and AMVL.
Mitral valve pathology (MS, MAC) or Aortic Regurgitation will all cause abnormal AMVL movements.
Simpson Biplane:
This is the gold-standard for measuring LV volumes and EF with echo (named after the mathematician Thomas Simpson, but current nomenclature is to avoid possessive eponyms). It requires an algorithm programmed into the ultrasound machine, but most POCUS machines will have this capability.
Biplane measurements require two apical views to be obtained (the two “planes“):
Apical 4-chamber, and at 90 degrees to this the
Apical 2-chamber
In both of these views, the endocardial border is carefully traced at end-systole, and end-diastole, to calculate the LV areas in the two views. The biplane measurement then converts these measurements into a series of twenty disks to calculate the volume.
The advantages of this method are that it is the most accurate method to measure EF as it will account for regional wall motion abnormalities in the LV, and is not affected by valvular pathology. Some machines can also calculate ‘LV strain’ if you add in an apical long-axis view which is more sensitive way to assess systolic function.
The disadvantages are that the measurements are operator-dependent, and good quality apical views must be obtained. It is very easy to foreshorten the apical views with a window which is too high, leading to inaccurate volumes. Furthermore, if the endocardial border cannot be clearly seen in both planes then measurement will be inaccurate. To counter this, modern machines have an function which autodetects the endocardial border to make the process less subjective making the role of the operator largely to optimise image acquisition and ensure that a true apical window is found.
See the image below to get an idea of how a bi-plane measurement works.
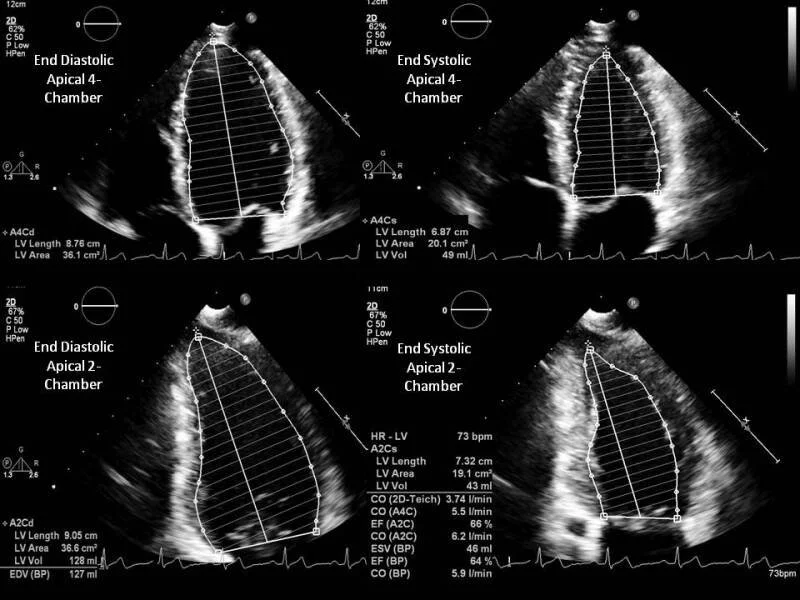
An example of how to calculate LVEF using the biplane method, tracing the endocardial border in both the A4C and A2C views in a normal heart.
Image credit from the article below which also has a comprehensive summary of LV Ejection Fraction.
Shams P, Goyal A, Makaryus AN. Left Ventricular Ejection Fraction. [Updated 2025 Jun 14]. In: StatPearls. PMID 29083812.
Caveats - Biplane
operator dependent, requires good apical images which are not foreshortened, and clearly image the endocardial border. This is difficult to do reliably unless you are an experienced operator but machine algorithms and AI can improve this.
In Summary:
Highlighted above are the most common methods to calculate LV function and EF. Remember that you can also measure stroke volume (discussed in previous cases, by measuring the LVOT VTI, combined with the LVOT diameter) to get an idea of LV function.
Try to calculate EF and estimate LV function on your patients. Comparing your findings with a subsequent formal echo report can be a good way to improve your skills. Likewise, reviewing formal echo cineloops, and then the calculated EF will improve your accuracy at visual estimation of EF which is an important skill in time-critical situations.
Case Conclusion:
Unfortunately this patient continued to deteriorate in ICU with worsening multi-organ failure as well as developing sepsis.
After consulting family, and considering his previous wishes, he was palliated in ICU.