
Cardiology Case #14
Primary Author: Dr Alastair Robertson; Co-Authors: Dr Hywel James and David Law
Background:
A 32 year old indigenous female presented to ED with 2 days of cough, breathlessness and fever. She had a background of T2DM and ischaemic heart disease.
Her observations were RR 25, Sats 94% on air, HR 100, BP 110/65, temp 37.8
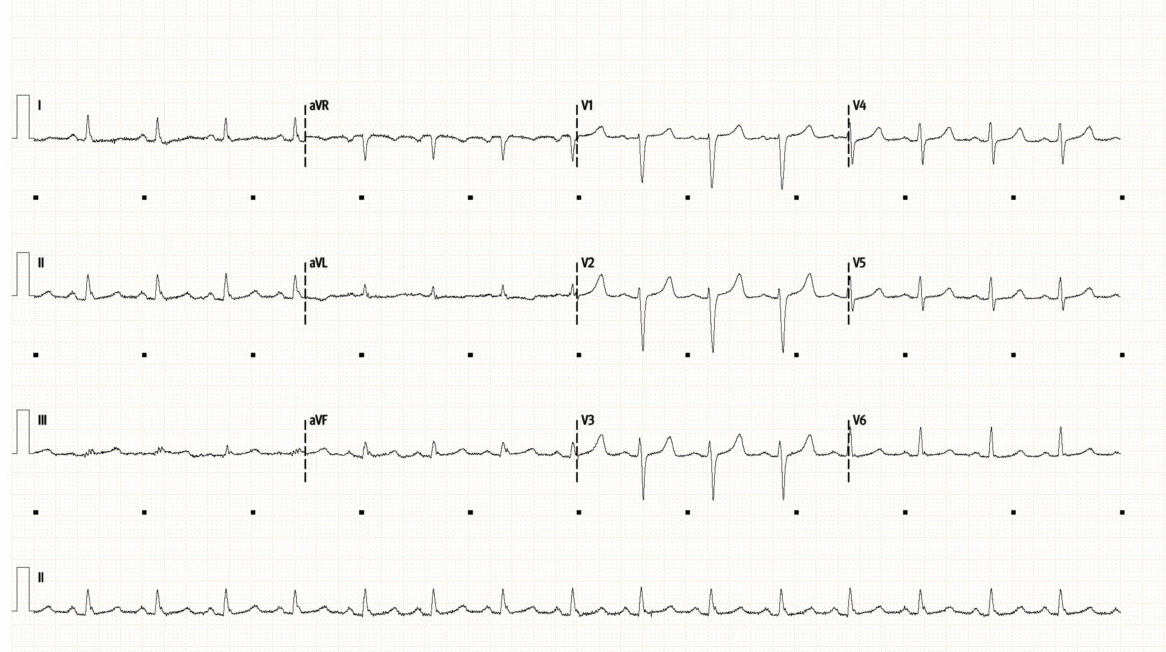
CXR and ECG are shown below
What do you think?

-
ECG shows sinus rhythm with a rate of around 95/min. The QRS is narrow, normal axis and intervals.
Very subtle ST elevation/PR depression in inferior lead (III, aVF) was thought to be non-specific.
Chest XR shows poor inspiratory effort, with bilateral infiltrates, particularly in the lower zones.
Heart size appears normal, there is no pneumothorax or obvious pleural effusion.
The differential here is infective process vs pulmonary oedema.
Cardiac POCUS:
In this case cardiac POCUS was used to assess overall cardiac function, and rule in a cardiogenic cause of her presentation.
Below is a parasternal long-axis (top video), and below that is a zoomed clip of the mitral valve (also PLAX).
How would you interpret the top clip?
Is there anything unusual about the valve on the bottom clip?
Basic POCUS:
Parasternal Long Axis (top): this is often the first view obtained in echo, and gives a lot of information about the heart. Start around 3rd-4th ICS at the left sternal edge, with the probe marker pointing around 10 o’clock.
Systematically assess for:
Pericardium: in this case a trace pericardial effusion can be seen both anteriorly, and posteriorly behind the LA. Too small to cause haemodynamic compromise but can be a clue to the pathology at play.
Overall LV function: in this case the LV has good systolic function, with no obvious hypokinesis of the anterior septum (top) or posterior wall (bottom). EF can be formally measured by multiple methods, here can be visually estimated at 65% (normal) largely excludes e.g. severe cardiomyopathy as cause of her symptoms.
LV Wall thickeness: a more advanced technique but LVH can be seen in pathologies such as hypertension, diastolic failure, aortic stenosis, inherited cardiomyopathies. Here it is upper limit of normal.
Right Ventricle: the most anterior (top) chamber seen is the RV or RVOT. Here it is not dilated and shows good systolic function (focus on the anterior, or free, wall at the top of the screen.
Aorta and Aortic Valve: The aorta does appear prominent, and needs measuring formally to exclude dilation of the root and ascending aorta. Consider pathologies such as chronic hypertension, aortic valve disease, aortic dissection or aneurysm. Here the aortic valve does appear thickened, particular centrally when the leaflets meet in diastole, but is visually opening well in systole thus excluding significant aortic stenosis.
Left Atrium: is seen here in the bottom right. As a rule of thumb the RV, Aorta, and LV should appear roughly equal in size on PLAX called the “1:1:1” rule. Here the left atrium appears dilated. It is best measured formally in the 4-chamber view but causes of this could be e.g. mitral valve disease, AF, heart failure, or aortic valve pathology.
Other: assess for pleural effusion (which will run behind the descending aorta) and also the descending aorta itself as dissection flap can be sometimes seen here.
Beyond Basic POCUS - the MITRAL VALVE (zoomed on bottom clip):
The bottom clip is a zoomed clip on the mitral valve, which is also slowed down to allow better assessment of valve movements.
Focus on the lower (posterior) leaflet:
The leaflet appears thickened, as does the chordae which are seen. The leaflet also does not open properly i.e. it is ‘restricted’. In a normal mitral valve, the posterior leaflet should fully open down towards the posterior wall.
Focus on the upper (anterior) leaflet:
The upper leaflet is also thickened, but is clearly opening. However if you look at the shape, the tip of the leaflet is pointed back downwards towards the posterior wall. This is because the leaflet tip is being restricted, and this shape is called “doming” of the leaflet. It is also sometimes called a “hockeystick” shape after the characteristic curve.
These mitral findings are characteristic of MITRAL STENOSIS, and in particular, of RHEUMATIC HEART DISEASE.
Intermediate POCUS:
Once rheumatic heart disease is suspected there are several important next steps.
1 — Assess for mitral regurgitation
Here a posteriorly-directed regurgitant jet is seen which is not trivial, so likely “mild-to-moderate” mitral regurgitation. The next clip is an Apical 2-Chamber view which is useful to determine which commisure the jet is passing through (see notes below). Here is passing between P3 and A2 (posteromedial commisure)
2 — Assess Mitral Valve Doppler
This is best achieved by putting CW doppler through the mitral valve from an Apical 4-Chamber view to get a saddle-shaped trace such as the one below. The first peak is the E-wave (diastolic filling), and the second peak is the A-wave (atrial kick).
The VTI is measured by tracing around the entire E-A curve during diastole (see dotted line on third complex). This will then calculate a Mean Peak Gradient (in this case VTI is 33.9cm and the Mean PG is 7mmHg). As a rough rule:
Mild to moderate mitral stenosis has a Mean PG 5-10mmHg
Severe mitral stenosis has a Mean PG greater than 10mmHg
* However the gradient will increase as heart rate increases, so always reference the Mean PG to the heart rate at time of study.
The Pressure Half-Time is a measure of the gradient of the deceleration slope immediately after the E-wave. If mitral stenosis is SEVERE, the pressures will start to equalise more slowly (as there only a small orifice through which blood can flow to equalise the pressure) and thus the slope will be less steep. Conversely, if MS is only MILD (and the valve area is relatively large) pressures can equalise quickly and the slope will be steep.
The gradient is marked here on the second complex (line between the two crosses) and the machine calculates the time for this pressure to half (in milliseconds). Here, the P1/2t is 80ms. As a guide:
Mild mitral stenosis P1/2t is around 100ms
Moderate mitral stenosis P1/2t is around 200ms
Severe mitral stenosis P1/2t is around 300ms
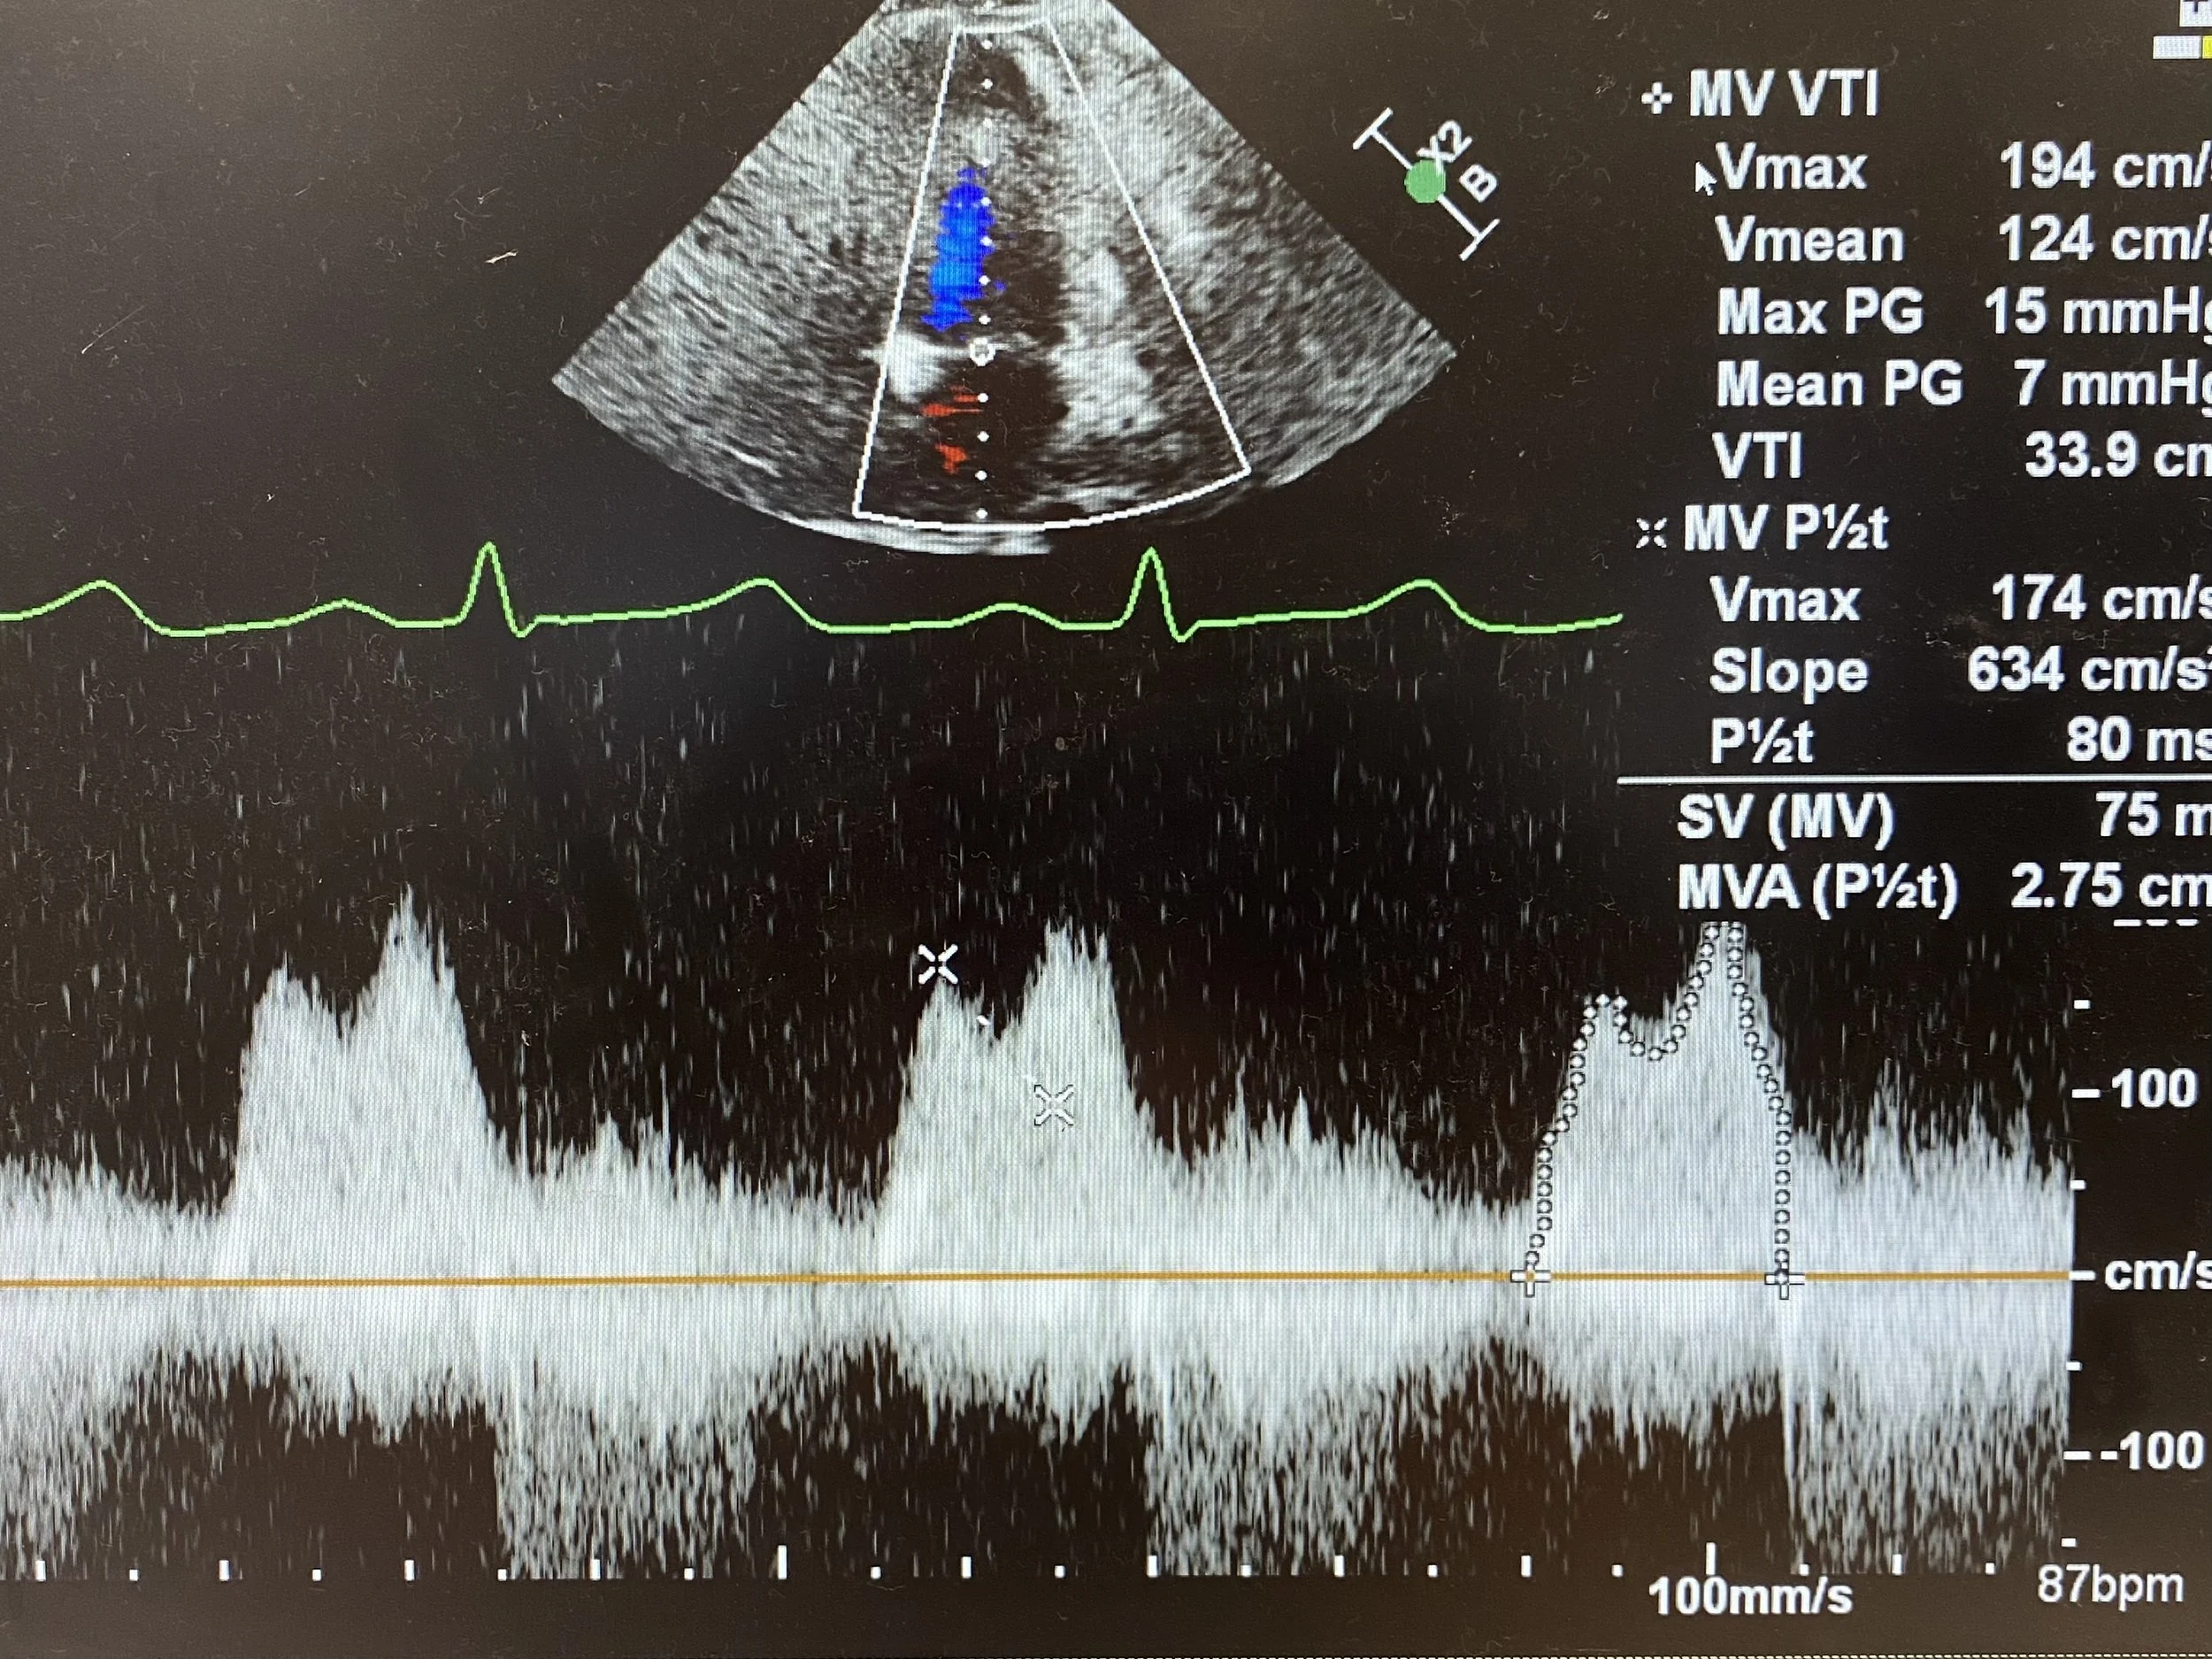
So in this case, the Mean PG is around 7 (in the mild to moderate range) but will likely decrease as the heart rate decreases (HR at time of study was 87). And the pressure half time is 80ms. Thus both of thess measurements are in keeping with only MILD Mitral Stenosis
Of note, there are other ways to assess the mitral valve in Rheumatic Heart Disease:
M-Mode can be used to assess the movements of the two leaflets (in PLAX view) however it is not as useful as CW doppler measurements.
Valve Area can be calculated by tracing around the mitral orifice opening in the PSAX view, however you need to be able to accurately image the valve opening. A normal valve area is around 3-5cm2.
1.5-3cm2 correlates with mild MS
1-1.5cm2 correlates with moderate MS
<1cm2 correlates with severe MS
In this case the valve area was calculated at 2.2cm2.
Case Conclusion:
The patient was thought to have a likely viral pneumonitis but was covered with antibiotics for respiratory sepsis and admitted to ICU for close monitoring and respiratory support.
An incidental diagnosis of Mild Mitral Stenosis secondary to rheumatic heart disease was made. This is an important diagnosis to make as treatments can be initiated, and close follow-up required as patients are at risk of developing atrial fibrillation as well as worsening MS requiring valve replacement.
Focus on MITRAL STENOSIS:
Causes:
“True” mitral stenosis is caused by rheumatic heart disease (RHD)
Severe calcific mitral annular calcification (MAC) can be a cause in the elderly
Other rarer causes include radiation therapy, congenital causes, atrial myxoma, systemic diseases such as SLE, and other supravalvular stenoses.
Echo Features:
Left atrial dilation and elevated pulmonary pressures
Atrial fibrillation (“valvular AF”)
Thickened leaflets and chordae (particularly in RHD)
Restricted posterior leaflet, and anterior leaflet “doming/hockeystick”
On CW Doppler:
Elevated Mean Peak Gradient
Elongated Pressure Half Time
Decreased Valve Area
Mitral calcification
Mitral Regurgitation
Other valvular involvement (particularly with Rheumatic MS)
Aortic Valve (most common) - focal leaflet thickening that starts centrally and spreads outwards [AS or AR]
Tricuspid disease [TR or TS]
Diagnosis:
Diagnosis of Acute Rheumatic Fever is made via the Jones classification. However, diagnosis of Rheumatic Heart Disease is made by echo, using the features listed above. Evidence of previous Group A Strep infection can be useful but not crucial for diagnosing RHD (e.g. throat cultures, ASO titre, anti-DNase B)
Management:
Antibiotics - usually IM Benzylpenicillin monthly for at least 5 years to prevent recurrence of rheumatic fever.
Anticoagulation for Atrial Fibrillation (generally warfarin is the preferred agent for valvular AF if mitral stenosis is moderate or severe)
HR control (beta-blockers, or CCBs) and diuretics to manage fluid and cardiovascular status
Surgical: Valvulotomy (Percutaneous or open), MVR
Unstable Patient
Treat Pulmonary oedema with NIV
Optimise Preload, avoid excessive afterload (consider GTN, diuresis)
Aim low-normal HR for optimal diastolic filling time
Aggressive AF management (DCCV, BB, Amiodarone)
Inotropes of choice (Noradrenaline, Dobutamine, Milrinone), avoid pure vasoconstrictors [increase PVR, increase afterload]
Mechanical supports - ECMO / IABP
See notes below for more details
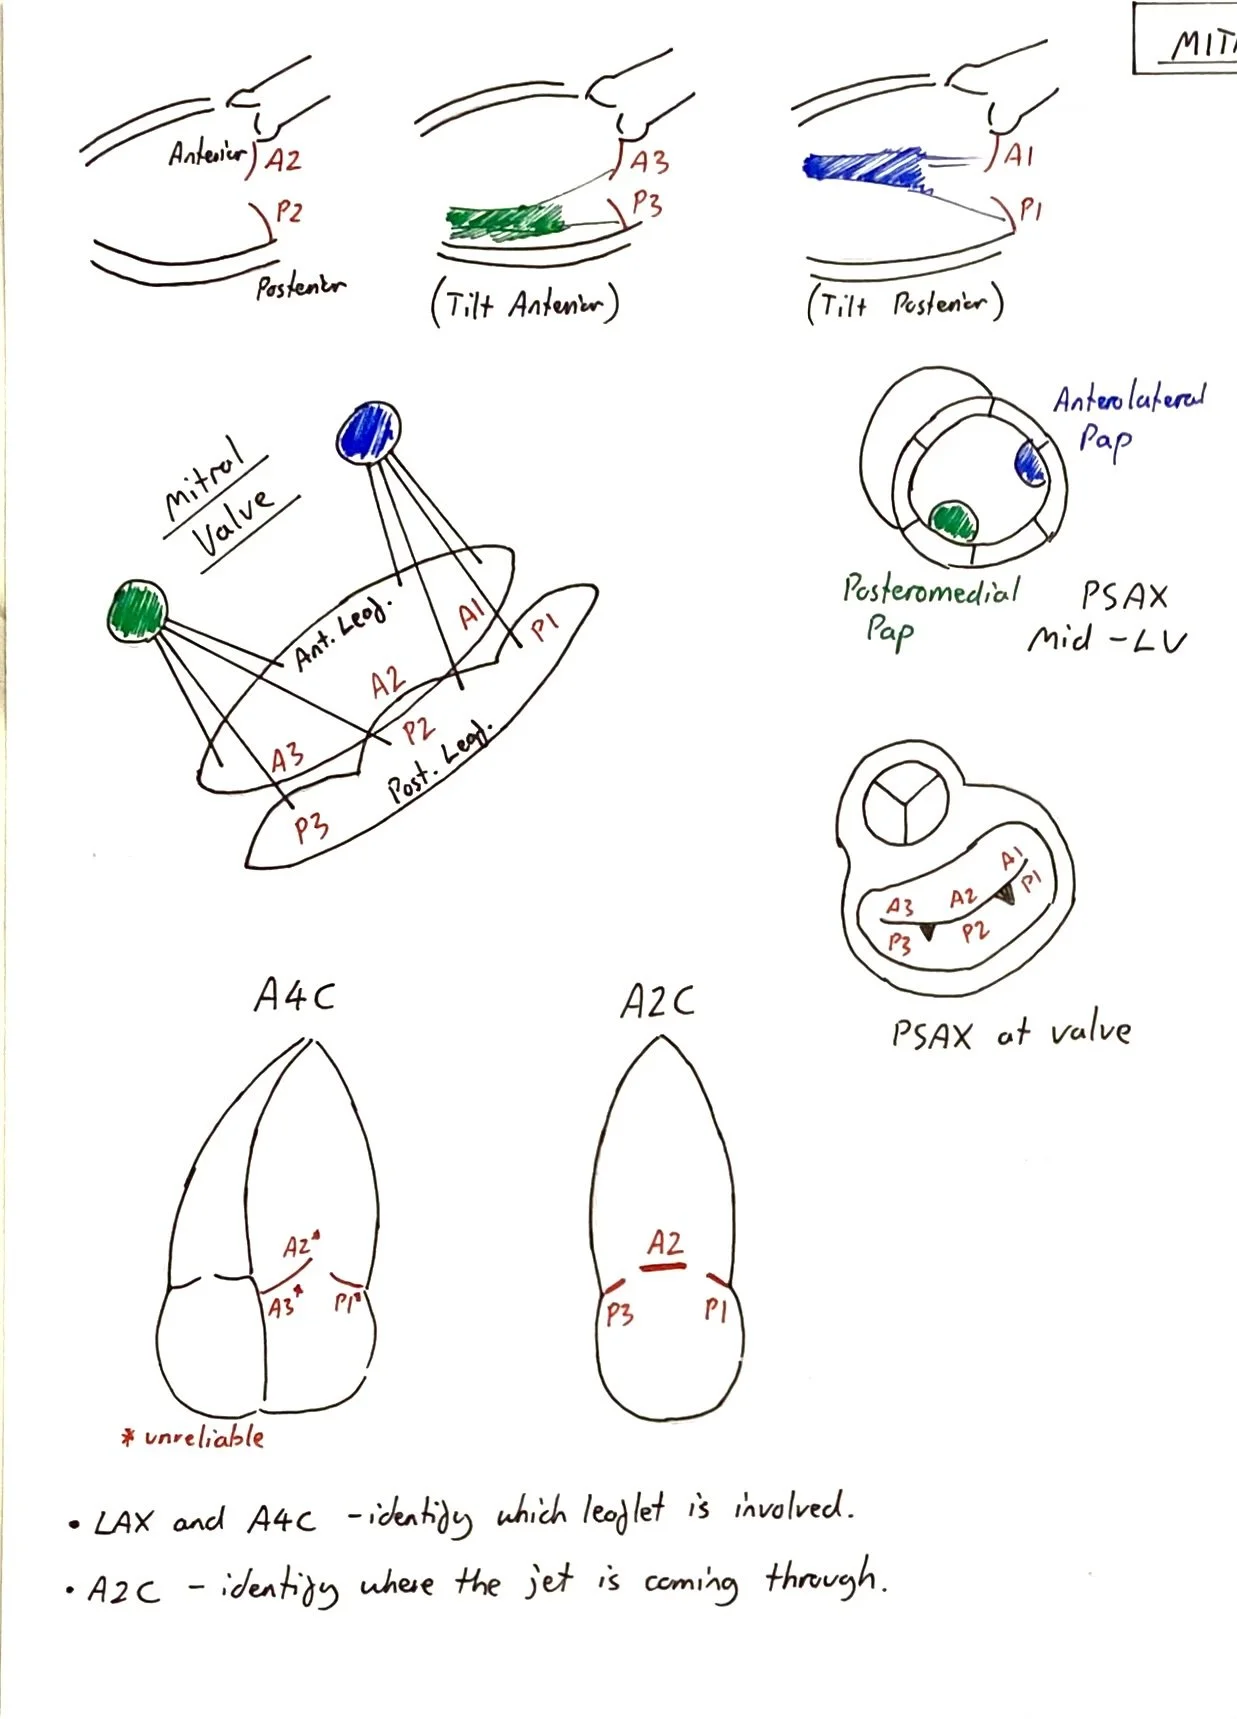
Drawings of the mitral valve